Generative Art With Python
by IoFAdmin at
python | programming | generative art

You Can Be the Next Jackson Pollock!
Well probably not at least you can create some cool looking art with Python code.
Standing On the Shoulders Of Giants
I'm still learning Generative Art and I needed a place to start so I took Absolute-Tinkerer's code and simplified it for learning purposes. Check it out on Github.
Digital Paintbrush?
So what is Generative Art anyway? Basically, it's writing code that follows some rules and uses random inputs to create unique art each time it's ran. There are many types of Generative Art but we're just going to focus on Flow Fields.
So What Do We Need?
We're going to be using four pieces of code:
- painter (from Absolute-Tinkerer)
- utils (from Absolute-Tinkerer)
- numpy (pip install numpy)
- our code below
Perlin Noise? What's That?
TL;DR In the 1980's this really smart guy working on the movie Tron came up with a way to make computer imagery look more organic and less artificial. You can read more about it on Wikipedia. We're using Perlin Noise to make our images look better.
Show Me The Code Already!
I'll show you the code and then we'll break down what it's doing. I'm still learning Generative Art so if I'm describing something incorrectly, please let me know in the comments below.
import math
import random

import numpy as np

from PyQt5.QtGui import QColor, QPen
from PyQt5.QtCore import QPointF

import painter
from utils import QColor_HSV, save, Perlin2D

def draw(width, height, color=200, backgroundColor=(0,0,0), perlinFactorW=2, perlinFactorH=2, step=0.001):
    seed = random.randint(0, 100000000)

    # Set the random seed for repeatability
    np.random.seed(seed)

    p = painter.Painter(width, height)

    # Allow smooth drawing
    p.setRenderHint(p.Antialiasing)

    # Draw the background color
    p.fillRect(0, 0, width, height, QColor( *backgroundColor ))

    # Set the pen color
    p.setPen(QPen(QColor(150, 150, 225, 5), 2))

    print('Creating Noise...')
    p_noise = Perlin2D(width, height, perlinFactorW, perlinFactorH)
    print('Noise Generated!')

    MAX_LENGTH = 2 * width
    STEP_SIZE = step * max(width, height)
    NUM = int(width * height / 1000)
    POINTS = [(random.randint(0, width - 1), random.randint(0, height - 1)) for i in range(NUM)]

    for k, (x_s, y_s) in enumerate(POINTS):
        print(f'{100 * (k + 1) / len(POINTS):.1f}'.rjust(5) + '% Complete', end='\r')

        # The current line length tracking variable
        c_len = 0

        # Actually draw the flow field
        while c_len < MAX_LENGTH:
            # Set the pen color for this segment
            sat = 200 * (MAX_LENGTH - c_len) / MAX_LENGTH
            hue = (color + 130 * (height - y_s) / height) % 360
            p.setPen(QPen(QColor_HSV(hue, sat, 255, 20), 2))

            # angle between -pi and pi
            angle = p_noise[int(x_s), int(y_s)] * math.pi

            # Compute the new point
            x_f = x_s + STEP_SIZE * math.cos(angle)
            y_f = y_s + STEP_SIZE * math.sin(angle)

            # Draw the line
            p.drawLine(QPointF(x_s, y_s), QPointF(x_f, y_f))

            # Update the line length
            c_len += math.sqrt((x_f - x_s) ** 2 + (y_f - y_s) ** 2)

            # Break from the loop if the new point is outside our image bounds
            # or if we've exceeded the line length; otherwise update the point
            if x_f < 0 or x_f >= width or y_f < 0 or y_f >= height or c_len > MAX_LENGTH:
                break
            else:
                x_s, y_s = x_f, y_f

    save(p, fname=f'image_{seed}', folder='.', overwrite=True)

draw(3000, 2000, color=63, perlinFactorW=4, perlinFactorH=5, step=0.35)
We import our Python modules:
import math
import random

import numpy as np

from PyQt5.QtGui import QColor, QPen
from PyQt5.QtCore import QPointF
Then we import in code from Absolute-Tinkerer's project (see above):
import painter
from utils import QColor_HSV, save, Perlin2D
Now we come to the draw function which has 2 positional arguments and 5 keyword arguments.:
def draw(width, height, color=200, backgroundColor=(0,0,0), perlinFactorW=2, perlinFactorH=2, step=0.001):
We'll describe the arguments when we get to them in the code.
seed = random.randint(0, 100000000)

# Set the random seed for repeatability
np.random.seed(seed)
We randomly select an integer between 0 and 100000000 and then use that number set a random seed in numpy
p = painter.Painter(width, height)

# Allow smooth drawing
p.setRenderHint(p.Antialiasing)

# Draw the background color
p.fillRect(0, 0, width, height, QColor( *backgroundColor ))

# Set the pen color
p.setPen(QPen(QColor(150, 150, 225, 5), 2))
In this part of the code, we define our painter which is an instance of QPainter (a class allowing us to "paint" pixels). Using our painter, we turn on antialiasing to smooth the angles, fill a rectangle with our provided background color and then finally set our pen color to draw.
print('Creating Noise...')
p_noise = Perlin2D(width, height, perlinFactorW, perlinFactorH)
print('Noise Generated!')
Here we're using Absolute-Tinkerer's Perlin Noise generator to make our noise. This will allow angle calculations further on in the code.
MAX_LENGTH = 2 * width
STEP_SIZE = step * max(width, height)
NUM = int(width * height / 1000)
POINTS = [(random.randint(0, width - 1), random.randint(0, height - 1)) for i in range(NUM)]
MAX_LENGTH acts as a guard so that we don't draw/calculate values outside of our image edges and it's also used in some color calculations. STEP_SIZE is used to calculate drawing points with smaller values leading to organic curves and larger values generating "chaotic" features. NUM dictates how many points we create. Finally, POINTS calculates points (X, Y coordinates) using list comprehension.
for k, (x_s, y_s) in enumerate(POINTS):
    print(f'{100 * (k + 1) / len(POINTS):.1f}'.rjust(5) + '% Complete', end='\r')
For each one of our points, get its (X, Y) coordinates and display our percentage completed for drawing our image.
# The current line length tracking variable
c_len = 0
Set our tracking variable to 0.
# Actually draw the flow field
while c_len < MAX_LENGTH:
Keep looping until our tracking variable is less than our image limit.
# Set the pen color for this segment
sat = 200 * (MAX_LENGTH - c_len) / MAX_LENGTH
hue = (color + 130 * (height - y_s) / height) % 360
p.setPen(QPen(QColor_HSV(hue, sat, 255, 20), 2))
Calculate our sat variable for our saturation value and hue for our hue value. (Read a nice explanation of hue and saturation.) Next we translate our values into a color and apply it to our painter's drawing pen.
# angle between -pi and pi
angle = p_noise[int(x_s), int(y_s)] * math.pi

# Compute the new point
x_f = x_s + STEP_SIZE * math.cos(angle)
y_f = y_s + STEP_SIZE * math.sin(angle)
Using our current (X, Y) coordinates in x_s and y_s we calculate our angle variable. Next, we find the cos of the angle, multiply it by STEP_SIZE, add it to our current X value. Follow a similar process with the current Y value. Now we have the coordinates of our new point!
# Draw the line
p.drawLine(QPointF(x_s, y_s), QPointF(x_f, y_f))
Create QPointFs for our current and new points and then draw a line between them.
# Update the line length
c_len += math.sqrt((x_f - x_s) ** 2 + (y_f - y_s) ** 2)
Square the difference between the old and new X values and add it to the squared difference between the old and new Y values. Take the square root of that value and add it to the current value of c_len.
# Break from the loop if the new point is outside our image bounds
# or if we've exceeded the line length; otherwise update the point
if x_f < 0 or x_f >= width or y_f < 0 or y_f >= height or c_len > MAX_LENGTH:
    break
else:
     x_s, y_s = x_f, y_f
If we're outside of the image bounds, do nothing. Otherwise save the new coordinates to the old coordinates variables. That way, they'll be available for the next iteration of the loop.
save(p, fname=f'image_{seed}', folder='.', overwrite=True)
Finally some simple code! We take our painter instance and save its pixels to our jpg image.
draw(3000, 2000, color=63, perlinFactorW=4, perlinFactorH=5, step=0.35)
Call the code and generate our masterpiece!
What Did We Learn?
By using some somewhat complicated math we can generate unique images with very limited inputs.
Bonus Section A.K.A Tweak Some Params
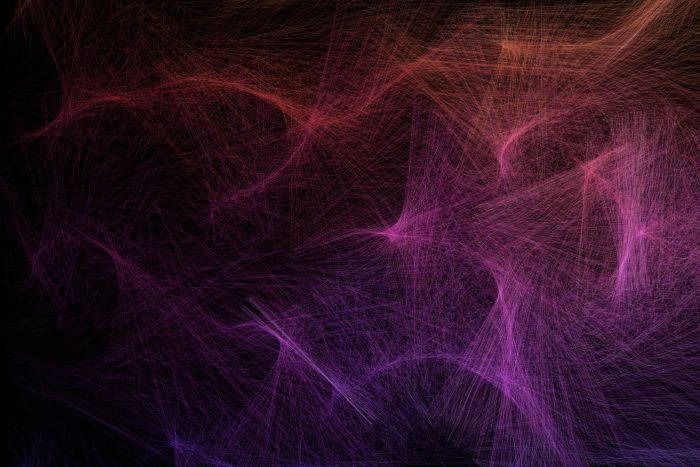
If we call the draw function using the parameters listed above we'll get a chaotic image that reminds us of string art. Why is that? Great question random Internet friend! With large step values (0.35 vs the default 0.001) we move farther apart between points and generate less points. That leads to lines instead of organic soft curves.
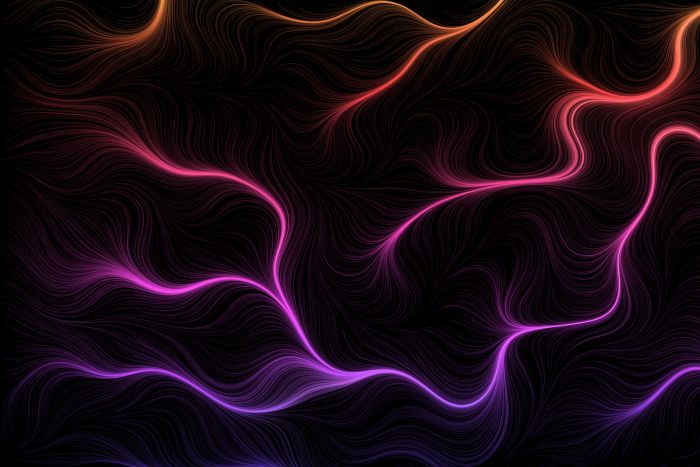
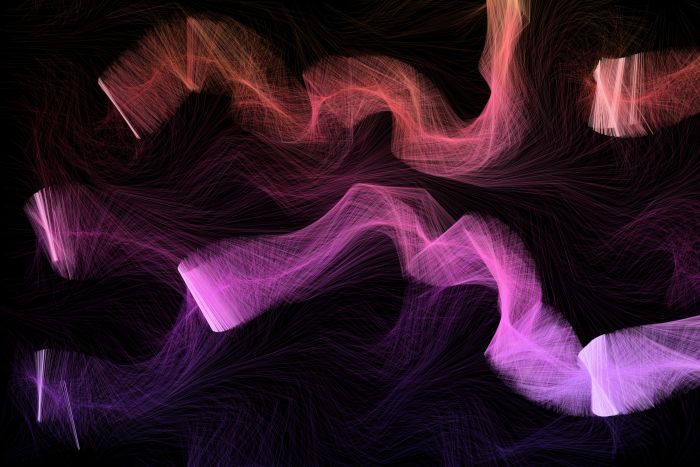
Try calling the function with different values for the step and Perlin factors to see what images you can make!